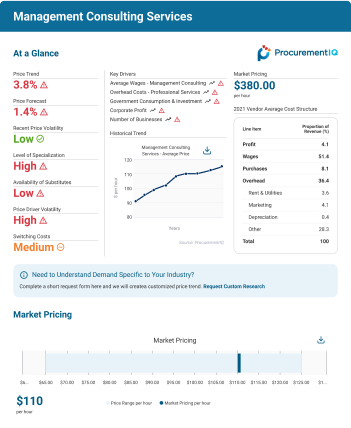
Smarter cost management starts with comprehensive market intelligence
Natural gas is a type of fossil fuel, meaning it is a nonrenewable resource, that comes in liquefied (LNG) or compressed (CNG) forms. Natural gas is measured in British Thermal Units (BTUs) or per million BTUs. Suppliers provide natural gas to buyers for use in heating, cooking, and power generation, as well as for fuel in transportation and manufacturing fertilizers. Key buyers include consumers and commercial users.
Tariffs to negatively impact the fuel additives, lubricants, and anti-corrosive materials sector
Country/Region | Number of Suppliers |
---|---|
#1China | 1,175 |
#2Europe | 750 |
#3India | 465 |
We've uncovered the 11 top regions for global procurement, based on feedback from our most strategic clients. Access vendor counts for each unique region when you subscribe.
Prices in the Natural Gas market range from $1.00 to $XX.XX, depending on Delivery Destination, Processing, Sector and Volume. For example, lower prices are associated with Gulf Coast ($2.00 to $12.00 per million BTUs) and Lower Atlantic ($2.00 to $11.00 per million BTUs), whereas higher prices are associated with West Coast ($4.00 to $16.00 per million BTUs and New England ($5.00 to $17.00 per million BTUs).
Between our Europe and Canada collections, we provide price data for 350 markets so you can instantly compare prices across borders. Or, use our custom research services for intel on prices in any region across the globe.
Pricing trends are indicated by the compound annual growth rate (CAGR) during a set period of time. For the Natural Gas market, prices in the US have declined -20.4% from 2022 to 2025. and --47.9% in Europe.
Price trend forecasts are available to subscribers, along with price driver projections and forward-looking cost structure data.
Total cost of ownership is Low in the Natural Gas market. The average cost of ownership differs depending on the contract but generally includes costs negotiated before the contract begins, costs billed during the contract period and unforeseen costs. For example, unforeseen costs in the form of Delays may raise the total cost of ownership unexpectedly.
In 2025, buyer power amounts to 0.5 in the United States. Buyer power is most positively impacted by Average Vendor Risk. It is most negatively impacted by Market Share Concentration. Subscribers can access details on eight other factors that impact buyer power. Learn more
Develop strategies for the upcoming year and identify unforeseen opportunities for buying now
The average level of supply chain risk is assessed as High, which has a negative impact on buyer power. The level of supply chain risk is affected by industry volatility, barriers to entry, competition, import penetration, regulation and industry financial risk. Buyers in this market can mitigate procurement and supply chain management risks by monitoring risk levels for individual first and second tier suppliers:
The largest Natural Gas vendors by revenue in the US are Duke Energy Corporation, Dominion Energy, Inc. and Devon Energy Corporation. Subscribers can sort and filter by market share concentration, profit level and other factors. Learn more
Supplier | Operational Size | Headquarters | Number of Employees | Market Share (%) | Market Share Performance (3yr trend) | Total Revenue ($ million) | Profit Level (%) | Risk Level |
---|---|---|---|---|---|---|---|---|
Berkshire Hathaway Inc. | Global | Omaha, NE | >10,000 | < 5 | ||||
The Southern Company | National | ATLANTA, GA | >10,000 | < 5 | ||||
Pg&E Corp | Local | OAKLAND, CA | >10,000 | < 5 | ||||
Exelon Corporation | International | CHICAGO | >10,000 | < 5 | ||||
Targa Resources Corp. | HOUSTON, TX | 1,001-10,000 | < 5 | |||||
Kinder Morgan, Inc. | International | HOUSTON | >10,000 | < 5 | ||||
Devon Energy Corporation | OKLAHOMA CITY | 1,001-10,000 | < 5 | |||||
Dominion Energy, Inc. | National | RICHMOND, VA | >10,000 | < 5 | ||||
Nisource Inc. | Regional | MERRILLVILLE, IN | 1,001-10,000 | < 5 |
Subscribers can access vendor information on Canadian and European suppliers, too. We also offer custom research services to help with vendor sourcing anywhere in the world.
The average profit margin across vendors in the Natural Gas market is 9.9% and steady. Profit levels shift depending on suppliers' spend on wages, purchases and overhead. The highest cost component for vendors is Wages. The cost trend for this component is rising, when considering movement between 2024 and 2025. To understand cost forecasts for 2026 and uncover the implications on profit, start your subscription. Learn more
Imports represent a very minimal share of the market as the United States is a net exporter of natural gas and remains one of the primary producers of natural gas globally. While buyers could seek imports from neighboring countries like Canada to increase supplier options to buyers and improve negotiation power, imported natural gas carries a higher risk of spilling and leaking over longer distances, as well as higher prices from import tariffs and greater transportation costs.
The financial risk level for suppliers of natural gas is high due to high capital costs and the resulting debt. Because of the recent spike in domestic extraction, natural gas suppliers have been investing heavily in improving and growing their operations and expanding their natural gas transportation methods. However, bankruptcy risk is mitigated by healthy profit margins.
During the past three years, market share concentration has been low in the natural gas market. While there are an estimated 445 suppliers in the market, none control more than 5.0% of market revenue. ProcurementIQ estimates that the top four suppliers generate less than 15.0% of market revenue.
Supply chain risk is high in the natural gas market. While there is little risk that a supplier will be unable to source oil and gas from upstream suppliers, especially because domestic production has been strong, the prices of these materials are highly volatile.
As political debates over natural gas intensify, the pace and frequency of change in market regulations can be anticipated to increase. Decisions on federal land sales, pipeline construction, exports, and industry-specific taxes will contribute to volatility in the supply of natural gas domestically.
Nextera Energy Inc. is a private company operating in the utilities and construction sectors. The company's offerings include renewable energy construction services and natural gas. The company is currently headquartered in United States of America, United States of America. Subscribe to learn more
West Texas Gas, Inc. is a private company operating in the utilities sector. The company's offerings include natural gas. Founded in 2017, the company is currently headquartered in United States of America. Subscribe to learn more
Duke Energy Corporation is a private company operating in the utilities and finance and insurance sectors. The company's offerings include natural gas and renewable energy credits brokerage services.. Subscribe to learn more
Atmos Energy Corp is a public company operating nationally in the utilities sector. The company's offerings include natural gas. Founded in 1906, the company is currently headquartered in Dallas, Texas, United States of America with an estimated 4791 employees. Subscribe to learn more
Nisource Inc. is a public company operating regionally in the utilities sector. The company's offerings include natural gas. Founded in 2015, the company is currently headquartered in MERRILLVILLE, Indiana, United States of America with an estimated 7162 employees. Subscribe to learn more
Dominion Energy, Inc. is a public company operating nationally in the utilities sector. The company's offerings include natural gas. Founded in 1983, the company is currently headquartered in RICHMOND, Virginia, United States of America with an estimated 17200 employees. Subscribe to learn more
Devon Energy Corporation is a public company operating in the utilities sector. The company's offerings include natural gas. Founded in 2017, the company is currently headquartered in OKLAHOMA CITY, Oklahoma, United States of America with an estimated 1800 employees. Subscribe to learn more
Kinder Morgan, Inc. is an energy infrastructure company operating in North America. It owns and operates an interest in pipelines, terminals, natural gas storage, oil and gas-producing fields, and facilities for renewable natural gas, liquefied natural gas, and landfill gas-to-electric. Its pipelines transport... Subscribe to learn more
Targa Resources Corp. is a public company operating in the utilities sector. The company's offerings include natural gas. Founded in 2018, the company is currently headquartered in HOUSTON, Texas, United States of America with an estimated 2850 employees. Subscribe to learn more
Get a clear picture of the competition in a market and discover which vendors are best-suited for your sourcing needs. Our supplier profiles include hard-to-find financial ranges for private companies, cover public company data and feature an interactive competitor matrix.
Managing vendor performance throughout the contract period is easier when tracking specific key performance indicators (KPIs). For example, buyers should monitor Average Order Value and Average Resolution Time. Buyers may experience better performance throughout their contracts if they establish service level agreements (SLAs) based on Delivery and other factors.
KPI | Level of Importance (1-5) | Measurements | Key Considerations |
---|---|---|---|
Average Order Value | Average value of each natural gas shipment Total revenue | Measuring the average value can help buyers assess spending behaviors. The average order value can be used to evaluate buyers' willingness to pay for a company’s products. | |
Average Resolution Time | Total resolution time Number of resolved tickets | The average resolution time represents the average amount of time it takes to resolve a customer support ticket. Vendors that can effectively resolve issues with delivery, billing, and pricing can help minimize disruptions for natural gas buyers. | |
Distribution
What is your past experience in working with a company of my size and operation specialty?
How many production and distribution points do you have around the United States?
Customer Service
How do you track customer satisfaction and do you have client references I can review?
How do you ensure timely and accurate shipping? What systems do you have in place to manage outgoing shipments?
Quality Control
What systems do you have in place to measure the quality of your natural gas supply?
How often do you provide leak tests? Are these included in the service contract or is there an additional cost?
View all 27 negotiation questions for this category when you subscribe.
Organizational Overview
Buyers should describe what kind of business they operate.
Buyers should include the full addresses of all delivery locations.
Statement Of Need
Buyers should explain what they intend to use the natural gas for.
Buyers should provide a monthly overview of their historical natural gas usage in the past year.
Project Budget
Buyers should include the index price per million BTUs and a fixed price per million BTUs.
Buyers should include the budgeting fees for transporting the natural gas to their location.
Find out how you can access RFP templates for 800+ procurement categories to start writing better, more consistent RFPs.
Copyright © 2025 ProcurementIQ.
All Rights Reserved.