Procurement Market Intelligence Report
Paper Cups
Sourcing Guide & Market Intelligence
Smarter cost management starts with comprehensive market intelligence
 United States
 Global
Quick Navigation
Paper Cups Global Overview
Definition
Summary
These items are primarily made of paper but are usually lined with plastic or wax so they can hold liquid and food without leaking or falling apart. Paper cups are typically disposed of or recycled after a single use. Paper cups are supplied by manufacturers, wholesalers, and retailers. Major buyers include restaurants, coffee shops and consumers.
This Report Includes:
- Standardized Paper Cups
- Customized Paper Cups
Not in this Report:
- Solid Fiber Boxes
- Plastic Cups
- Paper Bags
Take the ProcurementIQ products and data tour
Explore live samples of price trend forecasts, price driver projections, forward-looking cost structure data and more.
Global Paper Cups Procurement Trends
Discover the top international trends affecting procurement in the global Paper Cups market.
Warning Trends
Tariffs are driving up paper and paperboard product prices
- The Trump administration’s reciprocal tariffs, which apply general tariff rate increases to all imports from most nations, are set to take effect on August 7 after the national tariff rates were finalized on August 1.
- As a result, the leading paper and paperboard product import sources, Canada, the European Union, China, and Mexico, all face significantly increased tariff rates of 35.0%, 15.0%, 54.0%, and 25.0%, respectively. Together, these countries account for 77.3% of paper and paperboard imports.
- However, USMCA-originating products, meaning those produced entirely in Canada or Mexico, are exempt from the elevated tariffs.
- The United States is highly reliant on paper and paperboard imports to meet domestic demand, with imports accounting for approximately 30.5% of total US consumption in this market.
- Due to these factors, the Yale Budget Lab anticipates tariffs will increase prices in the paper and paperboard market by 5.3% in the short term.
Global Paper Cups Market - Suppliers by Region
| Country/Region | Number of Suppliers |
|---|---|
| #1 China | 27,635 |
| #2 Europe | 25,540 |
| #3 Oceania & Southeast Asia | 22,905 |
Explore supplier concentration across the globe
We've uncovered the 11 top regions for global procurement, based on feedback from our most strategic clients. Access vendor counts for each unique region when you subscribe.
Geography Drilldown - US
Average Cost of Paper Cups
United States
2026 Market Pricing$15.50 to $XXX.XX
per 500 paper cupsAverage Price
Prices in the Paper Cups market range from $15.50 to $XXX.XX, depending on Size, Quality of Materials, Customization and Order Size. For example, lower prices are associated with 3-8 ounce cups ($10.49 to $48.95 per 500 cups) and 9-16 ounce cups ($17.62 to $90.00 per 500 cups), whereas higher prices are associated with 20-22 ounce cups ($58.90 to $101 per 500 cups), 24-28 ounce cups ($73.95 to $104 per 500 cups) and 32-44 ounce cups ($56.79 to $110 per 500 cups).
Need the scoop on international price trends?
Between our Europe and Canada collections, we provide price data for 350 markets so you can instantly compare prices across borders. Or, use our custom research services for intel on prices in any region across the globe.
Paper Cups Category Price Trends
Pricing trends are indicated by the compound annual growth rate (CAGR) during a set period of time. For the Paper Cups market, prices in the US have grown 4.0% from 2022 to 2025. Subscribers can access price trend forecasts, price driver projections and forward-looking cost structure data. Learn more
United States (2022-2025)


Wondering where prices are heading?
Price trend forecasts are available to subscribers, along with price driver projections and forward-looking cost structure data.
Cost Analysis - Total Cost of Ownership for Paper Cups
Total cost of ownership is Low in the Paper Cups market. The average cost of ownership differs depending on the contract but generally includes costs negotiated before the contract begins, costs billed during the contract period and unforeseen costs.
Negotiated Before
Transportation
Billed During
Storage
Consumables
Hardware
Buyer Power in Procurement Negotiations
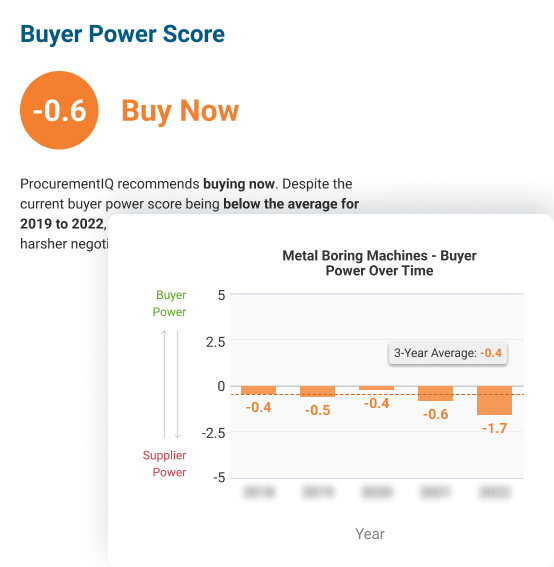
In 2026, buyer power amounts to -2.6 in the United States. Buyer power is most positively impacted by Recent Developments. It is most negatively impacted by Availability of Substitutes. Subscribers can access details on eight other factors that impact buyer power. Learn more
United States
Buyer power forecasts: your glimpse into the future
Develop strategies for the upcoming year and identify unforeseen opportunities for buying now
- Actionable "Buy Now" and "Buy Later" insights
- Near-real-time updates to current and forecast Buyer Power Scores
- Methodology and weightings for Buyer Power Score Components
Supply Chain Risk
The average level of supply chain risk is assessed as High, which has a negative impact on buyer power. The level of supply chain risk is affected by industry volatility, barriers to entry, competition, import penetration, regulation and industry financial risk. Buyers in this market can mitigate procurement and supply chain management risks by monitoring risk levels for individual first and second tier suppliers:
1st
Tier Suppliers
- Wood Pulp Mills
- Paper Mills
- Ink Manufacturers
2nd
Tier Suppliers
- Logging Companies
- Recycling Facilities
- Dye & Pigment Manufacturers
Biggest Paper Cups Suppliers in the US by Revenue
The largest Paper Cups vendors by revenue in the US are W.W. Grainger, Inc., Dart Container Corp and Georgia-Pacific Llc. Subscribers can sort and filter by market share concentration, profit level and other factors. Learn more
| Supplier | Operational Size | Headquarters | Number of Employees | Market Share (%) | Market Share Performance (3yr trend) | Total Revenue ($ million) | Profit Level (%) | Risk Level |
|---|---|---|---|---|---|---|---|---|
| Graphic Packaging Holding Company | Global | ATLANTA | >10,000 | 5-10 | ||||
| Dart Container Corp | Global | Mason, MI | >10,000 | 5-10 | ||||
| Georgia-Pacific Llc | Global | Atlanta, GA | >10,000 | 5-10 | ||||
| Sysco Corporation | Global | HOUSTON, TX | >10,000 | < 5 | ||||
| Us Foods Holding Corp. | National | ROSEMONT, IL | >10,000 | < 5 | ||||
| W.W. Grainger, Inc. | Global | LAKE FOREST | >10,000 | < 5 | ||||
| The Jim Pattison Group | International | Vancouver, CA | >10,000 | < 5 | ||||
| The Odp Corporation | International | BOCA RATON, FL | 1,001-10,000 | < 5 | ||||
| Pactiv Evergreen Inc. | Global | LAKE FOREST | >10,000 | < 5 | ||||
Looking for a list of suppliers by country?
Subscribers can access vendor information on Canadian and European suppliers, too. We also offer custom research services to help with vendor sourcing anywhere in the world.
Profit Analysis
The average profit margin across vendors in the Paper Cups market is 4.1% and steady. Profit levels shift depending on suppliers' spend on wages, purchases and overhead. The highest cost component for vendors is Purchases. The cost trend for this component is falling, when considering movement between 2025 and 2026. To understand cost forecasts for 2027 and uncover the implications on profit, start your subscription. Learn more
Vendor & Supply Chain Analysis
Moderate vendor risk does not pose a major threat to buyer power.
High supply chain risk has weakened buyer power during the past three years by raising the risk of supply disruptions or higher prices stemming from supply chain events.
Low market share concentration benefits buyer power by promoting price competition between suppliers.
The United States is a net importer of paper cups, importing more paper cups than it exports. Buyers importing paper cups should consider the possibility for longer lead times and higher shipping costs.
Supplier Information
Dart Container Corp
Dart Container Corp is a private company operating globally in the manufacturing sector. The company's offerings include polystyrene foam and paper cups. Founded in 1937, the company is currently headquartered in Mason, Michigan, United States of America with an estimated 15000 employees. Subscribe to learn more
Georgia-Pacific Llc
Georgia-Pacific Llc is a private company operating globally in the manufacturing sector. The company's offerings include wood pulp, plywood, particleboard, medium density fiberboard, engineered wood products. Founded in 1927, the company is currently headquartered in Atlanta, Georgia, United States of America... Subscribe to learn more
Graphic Packaging Holding Company
Graphic Packaging Holding Company is a global consumer packaging company. It offers paperboard packaging solutions, including unbleached, bleached, and recycled paperboard, for food, beverage, restaurants, food service providers, air filter frames, and healthcare and beauty aids end markets. It operates various... Subscribe to learn more
Huhtamaki Group
Huhtamaki Group is a public company operating globally in the manufacturing sector. The company's offerings include paper cups, flexible packaging and molded fiber packaging. Founded in 1941, the company is currently headquartered in Espoo, Finland with an estimated employee count of over 10,000. Subscribe to learn more
Lollicup USA Inc.
Lollicup USA Inc. is a private company operating nationally in the manufacturing sector. The company's offerings include paper cups. Founded in 2000, the company is currently headquartered in Chino, California, United States of America with an estimated 375 employees. Subscribe to learn more
Novolex Holdings LLC
Novolex Holdings LLC is a private company operating globally in the manufacturing sector. The company's offerings include plastic film, laminated papers, paper cups, paper bags, plastic bags. Founded in 2004, the company is currently headquartered in Hartsville, South Carolina, United States of America with... Subscribe to learn more
Pactiv Evergreen Inc.
Pactiv Evergreen Inc. is a packaging company serving fresh food service, food merchandising, and beverage markets. It manufactures and distributes food containers, drinkware, tableware, service ware, products for on-the-go and ready-to-eat food, clear rigid-display containers, trays for meat and poultry, Subscribe to learn more
Staples Inc.
Staples Inc. is a private company operating globally in the manufacturing, manufacturing, manufacturing, information, professional, scientific & technical services and administration, business support and waste management services sectors. The company's offerings include printing & writing paper, business... Subscribe to learn more
Sysco Corporation
Sysco Corporation is a public company operating globally in the manufacturing, wholesale trade and healthcare and social assistance sectors. The company's offerings include paper cups, paper bags, small kitchen appliances, food distribution services and natural disaster & emergency relief services. Founded... Subscribe to learn more
Accelerate the vendor selection process
Get a clear picture of the competition in a market and discover which vendors are best-suited for your sourcing needs. Our supplier profiles include hard-to-find financial ranges for private companies, cover public company data and feature an interactive competitor matrix.
Procurement Management KPIs for the Paper Cups Market
Managing vendor performance throughout the contract period is easier when tracking specific key performance indicators (KPIs). For example, buyers should monitor Average Response Time and Defect Density. Buyers may experience better performance throughout their contracts if they establish service level agreements (SLAs) based on Delivery and other factors.
| KPI | Level of Importance (1-5) | Measurements | Key Considerations |
|---|---|---|---|
| Average Response Time |
|
Average response time Average resolution time |
Average response time is an indicator of the responsiveness of the supplier’s customer service staff. Responsive customer service will help resolve issues in a timely fashion. The supplier’s customer service staff should respond to all queries within 24 hours. |
| Defect Density |
|
Defect density Percentage of goods with leaks |
The defect density refers to the percentage of products that are delivered with defects such as leaks, wrinkles or stains. A high share of defective products will limit supply as defective products cannot be used to serve customers or employees. Suppliers that persistently exceed the maximum defect density agreed to by the buyer should not be considered for renewal. |

Questions to Ask During Procurement Negotiations
How can I gain leverage during negotiations?
Quality Control
How do you check for quality? Do you rely on manual systems or computerized systems?
How often do you examine batches for quality? How often do you update your quality control procedures?
Inventory Control
How many manufacturing locations do you have? How many warehouse locations?
What is your maximum production capacity?
Customer Service
What is the best method to reach your customer service representatives?
Do you have reviews and references from buyers? What about for each of the products that you offer?
The ultimate prep for procurement negotations
View all 26 negotiation questions for this category when you subscribe.
Paper Cups RFP Guidelines
What should my RFP include?
Organizational Overview
Buyers should provide some background on their organization and explain why they are seeking paper cups.
Buyers should specify the size of their organization.
Statement Of Need
Buyers should indicate the range of products needed.
Buyers must detail the exact dimensions of the cups desired in terms of height, width, and diameter.
Project Budget
Buyers can impart the desired price range for each product needed, including adjustments to potential price increases.
Buyers should explain terms of payments, including preferred payment methods, frequency, timing, and value.
The RFP process made easy
Find out how you can access RFP templates for 800+ procurement categories to start writing better, more consistent RFPs.
We display average pricing information, trends and market data.
Our Reports include:
- Opportunity assessment
- Market dynamics
- Recent developments
- Positive and warning trends
- Buyer power levers
- Price environment and market pricing
- Geographic wage rates
- Global market updates
- Total cost of ownership
- Cost structure benchmarks and analysis
- Supply chain and vendors
- Global supplier breakdown
- Market share concentration
- Regulation and business requirements
- Vendor management and KPIs
- Sourcing strategy guidance