Procurement Market Intelligence Report
Chassis Leasing
Sourcing Guide & Market Intelligence
Smarter cost management starts with comprehensive market intelligence
 United States
 Global
Quick Navigation
Chassis Leasing Global Overview
Definition
Summary
A chassis is a rectangular, wheeled steel frame that typically has eight tires. Trucking companies use chassis to transport intermodal containers over land between ocean-going vessels, railroad ramps, distribution centers, warehouses, and other delivery points served by motor carriers. Typical buyers are trucking companies, ocean carriers, and railroad companies.
This Report Includes:
- Chassis Leasing
- Daily Rentals
- Chassis Pooling
- Operating Leases
- Financing Leases
Not in this Report:
- Intermodal Container Renting
- Truck Trailers
- Truck Trailer Leasing
Classification:
Take the ProcurementIQ products and data tour
Explore live samples of price trend forecasts, price driver projections, forward-looking cost structure data and more.
Global Chassis Leasing Market - Suppliers by Region
| Country/Region | Number of Suppliers |
|---|---|
| #1 India | 420 |
| #2 Oceania & Southeast Asia | 295 |
| #3 China | 225 |
Explore supplier concentration across the globe
We've uncovered the 11 top regions for global procurement, based on feedback from our most strategic clients. Access vendor counts for each unique region when you subscribe.
Geography Drilldown - US
Average Cost of Chassis Leasing
United States
2026 Market Pricing$22.00 to $XX.XX
per diemAverage Price
Prices in the Chassis Leasing market range from $22.00 to $XX.XX, depending on Region, Shipping Arrangement, Type of Chassis, Chassis Condition and Type of Lease. For example, lower prices are associated with Midwest ($23.00 to $28.00 per diem), Gulf of Mexico ($19.00 to $35.00 per diem) and Southeast ($23.00 to $35.00 per diem), whereas higher prices are associated with Pacific Southwest ($35.00 to $50.00 per diem), Northeast ($29.00 to $37.00 per diem) and Pacific Northwest ($31.00 to $35.00 per diem).
Need the scoop on international price trends?
Between our Europe and Canada collections, we provide price data for 350 markets so you can instantly compare prices across borders. Or, use our custom research services for intel on prices in any region across the globe.
Chassis Leasing Category Price Trends
Pricing trends are indicated by the compound annual growth rate (CAGR) during a set period of time. For the Chassis Leasing market, prices in the US have grown 1.2% from 2022 to 2025. Subscribers can access price trend forecasts, price driver projections and forward-looking cost structure data. Learn more
United States (2022-2025)


Wondering where prices are heading?
Price trend forecasts are available to subscribers, along with price driver projections and forward-looking cost structure data.
Cost Analysis - Total Cost of Ownership for Chassis Leasing
Total cost of ownership is Low in the Chassis Leasing market. The average cost of ownership differs depending on the contract but generally includes costs negotiated before the contract begins, costs billed during the contract period and unforeseen costs. For example, unforeseen costs in the form of Restocking may raise the total cost of ownership unexpectedly.
Negotiated Before
Financing
Transportation
Customization
Billed During
Depreciation
Support
Insurance
Unforeseen
Restocking
Delays
Cancellations
Buyer Power in Procurement Negotiations
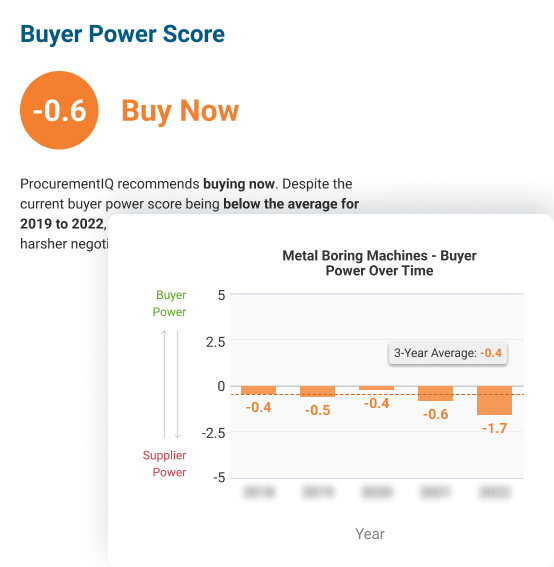
In 2026, buyer power amounts to -2.0 in the United States. Buyer power is most positively impacted by Market Share Concentration. It is most negatively impacted by Product Specialization. Subscribers can access details on eight other factors that impact buyer power. Learn more
United States
Buyer power forecasts: your glimpse into the future
Develop strategies for the upcoming year and identify unforeseen opportunities for buying now
- Actionable "Buy Now" and "Buy Later" insights
- Near-real-time updates to current and forecast Buyer Power Scores
- Methodology and weightings for Buyer Power Score Components
Supply Chain Risk
The average level of supply chain risk is assessed as Medium, which has a negative impact on buyer power. The level of supply chain risk is affected by industry volatility, barriers to entry, competition, import penetration, regulation and industry financial risk. Buyers in this market can mitigate procurement and supply chain management risks by monitoring risk levels for individual first and second tier suppliers:
1st
Tier Suppliers
- Truck & Bus Manufacturers
- Tire Manufacturers
- Port & Harbor Operations
2nd
Tier Suppliers
- Iron & Steel Manufacturers
- Rubber Product Manufacturers
- Stevedoring & Marine Cargo Handling Service Providers
Biggest Chassis Leasing Suppliers in the US by Revenue
The largest Chassis Leasing vendors by revenue in the US are Flexi-Van Leasing, Llc, Compass Container Group Inc. and Milestone Equipment Holdings, Llc. Subscribers can sort and filter by market share concentration, profit level and other factors. Learn more
| Supplier | Operational Size | Headquarters | Number of Employees | Market Share (%) | Market Share Performance (3yr trend) | Total Revenue ($ million) | Profit Level (%) | Risk Level |
|---|---|---|---|---|---|---|---|---|
| Flexi-Van Leasing, Llc | National | Scottsdale, AZ | 101-250 | 20-25 | ||||
| Direct Chassislink, Inc. | National | Charlotte, NC | 251-500 | 25+ | ||||
| Trac Intermodal Llc | National | Princeton, NJ | 501-1,000 | 25+ | ||||
| Kawasaki Kisen Kaisha Ltd | Global | Tokyo, JP | >10,001 | < 5 | ||||
| National Chassis | International | Beaumont, TX | 501-1,000 | < 5 | ||||
| Compass Container Group Inc. | Local | Oakland, CA | <25 | < 5 | ||||
| Milestone Equipment Holdings, Llc | National | St. Charles, MO | 101-250 | < 5 | ||||
| Penn Intermodal Leasing, LLC | National | Bala Cynwyd, PA | 51-100 | < 5 | ||||
| Star Leasing Company | National | Columbus, OH | 101-250 | < 5 | ||||
Looking for a list of suppliers by country?
Subscribers can access vendor information on Canadian and European suppliers, too. We also offer custom research services to help with vendor sourcing anywhere in the world.
Profit Analysis
The average profit margin across vendors in the Chassis Leasing market is 15.0% and steady. Profit levels shift depending on suppliers' spend on wages, purchases and overhead. The highest cost component for vendors is Overhead. The cost trend for this component is stagnating, when considering movement between 2025 and 2026. To understand cost forecasts for 2027 and uncover the implications on profit, start your subscription. Learn more
Vendor & Supply Chain Analysis
Average vendor risk is low in the chassis leasing market as providers generate high profit margins, but unstable demand trends offset low risk slightly. Overall, the reduced risk of bankruptcy, which could otherwise cause service disruptions, benefits buyers.
Market share concentration is very high in the market and is dominated by three to four suppliers (mainly Direct Chassislink, TRAC Intermodal, and Flexi-Van Leasing), reducing buyer power. Major lessors benefit from economies of scale, which allow them to spread out fixed costs more efficiently than minor lessors.
The chassis leasing market’s supply chain risk is moderate, which reduces buyer power because providers face a greater likelihood of supply chain disruptions. Tariffs on Chinese chassis and steel, coupled with consistent chassis shortages and suppliers’ reliance on structurally risky tire manufacturers, have contributed to shortages and delayed deliveries for buyers that have somewhat elevated the supply chain risk.
As the United States is a net importer of chassis, meaning they import more chassis than they export, chassis lessors rely on international suppliers more, which can introduce exposure to tariffs, supply chain issues, and long delivery times.
Supplier Information
Flexi-Van Leasing, Llc
Flexi-Van Leasing, Llc is a private company operating nationally in the real estate & rental & leasing sector. The company's offerings include chassis leasing. Founded in 1955, the company is currently headquartered in Scottsdale, Arizona, United States of America with an estimated 175 employees. Subscribe to learn more
Direct Chassislink, Inc.
Direct Chassislink, Inc. is a private company operating nationally in the real estate & rental & leasing sector. The company's offerings include chassis leasing. Founded in 1988, the company is currently headquartered in Charlotte, North Carolina, United States of America with an estimated 375 employees. Subscribe to learn more
Trac Intermodal Llc
Trac Intermodal Llc is a private company operating nationally in the real estate & rental & leasing sector. The company's offerings include chassis leasing. Founded in 1968, the company is currently headquartered in Princeton, New Jersey, United States of America with an estimated 750 employees. Subscribe to learn more
Compass Container Group Inc.
Compass Container Group Inc. is a private company operating locally in the real estate & rental & leasing sector. The company's offerings include chassis leasing. Founded in 2001, the company is currently headquartered in Oakland, California, United States of America with an estimated 25 employees. Subscribe to learn more
Kawasaki Kisen Kaisha Ltd
Kawasaki Kisen Kaisha Ltd is a public company operating globally in the real estate & rental & leasing sector. The company's offerings include chassis leasing. Founded in 1919, the company is currently headquartered in Tokyo, Japan with an estimated employee count of over 10,000. Subscribe to learn more
Milestone Equipment Holdings, Llc
Milestone Equipment Holdings, Llc is a private company operating nationally in the real estate & rental & leasing sector. The company's offerings include chassis leasing. Founded in 1995, the company is currently headquartered in St. Charles, Missouri, United States of America with an estimated 175 employees.... Subscribe to learn more
National Chassis
National Chassis is a private company operating internationally in the real estate & rental & leasing sector. The company's offerings include chassis leasing. Founded in 1963, the company is currently headquartered in Beaumont, Texas, United States of America with an estimated 509 employees. Subscribe to learn more
Penn Intermodal Leasing, LLC
Penn Intermodal Leasing, LLC is a private company operating nationally in the real estate & rental & leasing sector. The company's offerings include chassis leasing. Founded in 1988, the company is currently headquartered in Bala Cynwyd, Pennsylvania, United States of America with an estimated 75 employees.... Subscribe to learn more
Star Leasing Company
Star Leasing Company is a private company operating nationally in the real estate & rental & leasing sector. The company's offerings include truck trailer leasing and chassis leasing. Founded in 1974, the company is currently headquartered in Columbus, Ohio, United States of America with an estimated 175 Subscribe to learn more
Accelerate the vendor selection process
Get a clear picture of the competition in a market and discover which vendors are best-suited for your sourcing needs. Our supplier profiles include hard-to-find financial ranges for private companies, cover public company data and feature an interactive competitor matrix.
Procurement Management KPIs for the Chassis Leasing Market
Managing vendor performance throughout the contract period is easier when tracking specific key performance indicators (KPIs). For example, buyers should monitor Average Time to Repair and Billable Utilization. Buyers may experience better performance throughout their contracts if they establish service level agreements (SLAs) based on Chassis Quality and other factors.
| KPI | Level of Importance (1-5) | Measurements | Key Considerations |
|---|---|---|---|
| Average Time to Repair |
|
Average length of time for maintenance and repairs Total amount of time spent on maintenance and repairs |
Average time to repair represents the average amount of time spent completing maintenance and repair. A low average time to repair is an indicator of the reliability of a supplier’s fleet. Most suppliers will often include maintenance and repair solutions for buyers. |
| Billable Utilization |
|
Chassis in fleet Chassis currently leased |
The utilization rate for chassis lessors indicates how many chassis are currently being leased versus how many are currently in the firm's fleet. Too high a utilization rate indicates a company may not have chassis available to lease, while too low a utilization rate could indicate poor quality products. An ideal utilization rate would be between 75 to 80%. |

Questions to Ask During Procurement Negotiations
How can I gain leverage during negotiations?
Location
At what ports or rail hubs do you operate? Have you had any disruptions to these operations?
Do you cooperate with any other lessors at the port or rail hub in question to broaden the number of terminals where I can pick up and drop off chassis?
Service & Maintenance
What inspections or maintenance do you perform each time a chassis is returned or checked out?
Who performs maintenance and repair on your chassis? Have your labor arrangements caused disputes with longshoremen at any ports?
Financing
Do you offer operating leases and finance leases? What are the standard durations of each lease type?
What trends have you observed over the past three years regarding preferences for lease type and duration?
The ultimate prep for procurement negotations
View all 27 negotiation questions for this category when you subscribe.
Chassis Leasing RFP Guidelines
What should my RFP include?
Organizational Overview
Buyers should describe their businesses, including their size and geographic locations.
Buyers should indicate whether they are currently sourcing chassis from any other vendor.
Statement Of Need
Buyers should describe the number and type of chassis they need.
Buyers should include the locations where the chassis rental will be needed.
Project Budget
Buyers should indicate the total value of the contract for chassis leasing, if available.
Buyers should include any expectations they have regarding payment schedule or method.
The RFP process made easy
Find out how you can access RFP templates for 800+ procurement categories to start writing better, more consistent RFPs.
We display average pricing information, trends and market data.
Our Reports include:
- Opportunity assessment
- Market dynamics
- Recent developments
- Positive and warning trends
- Buyer power levers
- Price environment and market pricing
- Geographic wage rates
- Global market updates
- Total cost of ownership
- Cost structure benchmarks and analysis
- Supply chain and vendors
- Global supplier breakdown
- Market share concentration
- Regulation and business requirements
- Vendor management and KPIs
- Sourcing strategy guidance