Procurement Market Intelligence Report
Petroleum & Chemical Trucking Services
Sourcing Guide & Market Intelligence
Smarter cost management starts with comprehensive market intelligence
 United States
 Europe
 Global
Quick Navigation
Petroleum & Chemical Trucking Services Global Overview
Definition
Summary
The suppliers of these services transport crude oil, refined petroleum products (e.g. gasoline, aviation fuel, fuel oils and lubricating oils) or other liquid chemicals. In this report, suppliers are also referred to as carriers, and buyers are also called shippers. The main buyers of these services include oil and gas extractors, chemical manufacturers and petroleum refineries.
This Report Includes:
- Transportation of Crude Oil
- Transportation of Refined Petroleum Products
- Transportation of Other Liquid Chemicals
Not in this Report:
- National Trucking Services
- Container Shipment of Petroleum Products or Chemicals in Barrels
- Rail Tank Shipping
- Other Transportation Services
Classification:
- Rail Tank Car Leasing Services
- Rail Cargo Transportation Services
- Inland Water Cargo Transportation Services
- Pipeline Integrity Management Services
- National Trucking Services
- 3D Printers
- Bulk Food-Grade Transportation Services
- Oil & Gas Pipeline Construction
- Oversize-Load Trucking Services
- Petroleum & Chemical Trucking Services
Take the ProcurementIQ products and data tour
Explore live samples of price trend forecasts, price driver projections, forward-looking cost structure data and more.
Global Petroleum & Chemical Trucking Services Procurement Trends
Discover the top international trends affecting procurement in the global Petroleum & Chemical Trucking Services market.
Warning Trends
Increased tariffs on copper imports take effect
- On August 1, the Trump administration implemented 50.0% tariffs on imported copper. Chile and Canada will be most impacted by these tariffs, as they account for a combined 87.0% of all copper imports in the United States.
- However, these tariffs are less sweeping than initially expected, only applying to semi-finished copper products, while excluding high-purity refined copper and copper input materials, such as ore and concentrate. As leading importers, such as Chile and Canada, have both high copper mining and refining capacities, they will likely avoid most of these tariffs by either exporting the copper in its unrefined form or refining the copper before exporting it to the United States
- These copper tariff exemptions limit the impact on the electronics and electrical equipment sectors because these applications require refined copper due to its optimal conductive properties.
- Thus, the prices of metal alloys that include copper, consumer products made from copper, tools, plumbing, corrosion-resistant alloys, and construction materials made from copper are forecast to rise by an average of 39.2%, according to the Yale Budget Lab.
Neutral
Crude oil prices dip, but natural gas and fuel prices remain volatile in 2025
- Oil prices have been falling with the introduction of higher tariffs and the predicted decline in global demand. The OPEC+ group of countries also announced they would be unwinding production cuts and increasing their collective output target for May by 411,000 barrels per day.
- Trade wars, ongoing conflict between Hamas and Israel, and general unrest in the Middle East are causing uncertainty surrounding oil prices, which has led to volatility in prices. In the third week of May 2025, crude oil prices hit $63.67 per barrel, but volatility remains as geopolitical concerns remain.
- Natural gas prices rallied early in 2025 with colder-than-usual temperatures in the United States and high demand, topping out at $4.68/MMBtu in March. Prices have since fallen with the onset of trade wars and weakening demand projections to $3.64/MMBtu in the third week of May 2025.
- The national average of gasoline prices has been rising slightly due to refinery maintenance/outages and blending issues, hitting a national average of $3.15 per gallon in the third week of May 2025. However, gasoline futures have been volatile, falling due to fears of oversupply and deepening concerns about weakening demand with tariffs, but rising after trade deals.
Global Petroleum & Chemical Trucking Services Market - Suppliers by Region
| Country/Region | Number of Suppliers |
|---|---|
| #1 India | 14,660 |
| #2 Oceania & Southeast Asia | 10,245 |
| #3 Africa & Middle East | 6,965 |
Explore supplier concentration across the globe
We've uncovered the 11 top regions for global procurement, based on feedback from our most strategic clients. Access vendor counts for each unique region when you subscribe.
Geography Drilldown - US & Europe
Average Cost of Petroleum & Chemical Trucking Services
United States
2026 Market Pricing$2.00 to $X.XX
per loaded mile
Average Price
Prices in the Petroleum & Chemical Trucking Services market range from $2.00 to $X.XX, depending on Diesel Prices, Route, Distance and Truck Capacity. For example, lower prices are associated with Low diesel price ($3 to $5 per loaded mile), whereas higher prices are associated with High diesel price ($5 to $10 per loaded mile).
Need the scoop on international price trends?
Between our Europe and Canada collections, we provide price data for 350 markets so you can instantly compare prices across borders. Or, use our custom research services for intel on prices in any region across the globe.
Petroleum & Chemical Trucking Services Category Price Trends
Pricing trends are indicated by the compound annual growth rate (CAGR) during a set period of time. For the Petroleum & Chemical Trucking Services market, prices in the US have grown 2.5% from 2022 to 2025. Meanwhile, the recent three-year CAGR for Europe is +0.0%.
United States (2022-2025)

Europe (2022-2025)

Compound Annual Growth Rate
Wondering where prices are heading?
Price trend forecasts are available to subscribers, along with price driver projections and forward-looking cost structure data.
Cost Analysis - Total Cost of Ownership for Petroleum & Chemical Trucking Services
Total cost of ownership is Low in the Petroleum & Chemical Trucking Services market. The average cost of ownership differs depending on the contract but generally includes costs negotiated before the contract begins, costs billed during the contract period and unforeseen costs. For example, unforeseen costs in the form of Cancellations may raise the total cost of ownership unexpectedly.
Negotiated Before
Customization
Billed During
Fuel
Unforeseen
Cancellations
Buyer Power in Procurement Negotiations
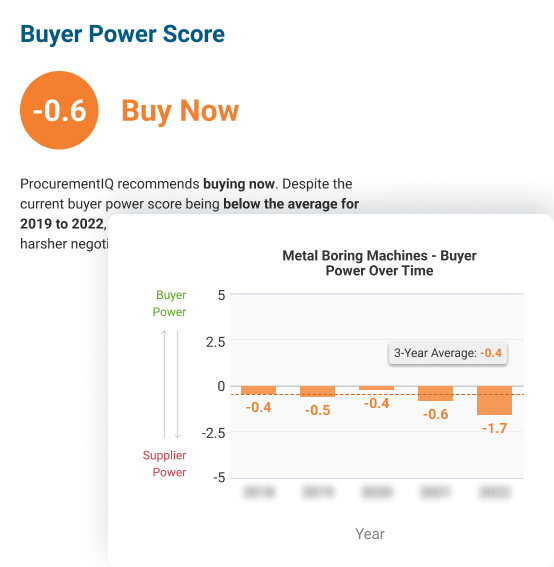
In 2026, buyer power amounts to -1.9 in the United States. Buyer power is most positively impacted by Recent Developments. It is most negatively impacted by Availability of Substitutes. Subscribers can access details on eight other factors that impact buyer power. Learn more
United States

Buyer power forecasts: your glimpse into the future
Develop strategies for the upcoming year and identify unforeseen opportunities for buying now
- Actionable "Buy Now" and "Buy Later" insights
- Near-real-time updates to current and forecast Buyer Power Scores
- Methodology and weightings for Buyer Power Score Components
Supply Chain Risk
The average level of supply chain risk is assessed as High, which has a negative impact on buyer power. The level of supply chain risk is affected by industry volatility, barriers to entry, competition, import penetration, regulation and industry financial risk. Buyers in this market can mitigate procurement and supply chain management risks by monitoring risk levels for individual first and second tier suppliers:
1st
Tier Suppliers
- Truck Manufacturers
- Tank Trailer Manufacturers
- Gasoline & Petroleum Wholesalers
2nd
Tier Suppliers
- Auto Parts Manufacturers
- Steel Rollers
- Gasoline & Petroleum Bulk Stations
Biggest Petroleum & Chemical Trucking Services Suppliers in the US by Revenue
The largest Petroleum & Chemical Trucking Services vendors by revenue in the US are Heniff Transportation Systems LLC, Kenan Advantage Group Inc. and Quality Carriers Inc. Subscribers can sort and filter by market share concentration, profit level and other factors. Learn more
| Supplier | Operational Size | Headquarters | Number of Employees | Market Share (%) | Market Share Performance (3yr trend) | Total Revenue ($ million) | Profit Level (%) | Risk Level |
|---|---|---|---|---|---|---|---|---|
| Knight-Swift Transportation Holdings Inc. | International | PHOENIX | >10,000 | < 5 | ||||
| Schneider National, Inc. | National | Green Bay, WI | >10,000 | < 5 | ||||
| Arcbest Corporation | National | Fort Smith, AR | >10,000 | < 5 | ||||
| Heniff Transportation Systems LLC | International | Oak Brook, IL | 1,001-10,000 | < 5 | ||||
| Kenan Advantage Group Inc. | International | North Canton, OH | 1,001-10,000 | < 5 | ||||
| Quality Carriers Inc. | International | Tampa, FL | 1,001-10,000 | < 5 | ||||
| Ruan Transportation Management Systems | International | Des Moines, IA | 1,001-10,000 | < 5 | ||||
| Blueknight Energy Partners, L.P. | National | TULSA, OK | 101-250 | < 5 | ||||
| Altom Transport Inc. | National | Hammond, IN | 101-250 | < 5 | ||||
Looking for a list of suppliers by country?
Subscribers can access vendor information on Canadian and European suppliers, too. We also offer custom research services to help with vendor sourcing anywhere in the world.
Profit Analysis
The average profit margin across vendors in the Petroleum & Chemical Trucking Services market is 9.3% and steady. Profit levels shift depending on suppliers' spend on wages, purchases and overhead. The highest cost component for vendors is Overhead. The cost trend for this component is stagnating, when considering movement between 2025 and 2026. To understand cost forecasts for 2027 and uncover the implications on profit, start your subscription. Learn more
Vendor & Supply Chain Analysis
The market has a high level of supply chain risk. Truck manufacturers, tank trailer manufacturers, auto parts manufacturers and steel rollers must all contend with volatility in the price of their key input, steel.
Fortunately for buyers, the high level of price-based competition and low market share concentration in this market benefits buyers. This generally impels suppliers to absorb at least some of their additional costs.
Vendor risk is moderate in the market, creating some risk of a discontinuity of service.
The United States is a net exporter of trailers and semi-trailers, indicating that domestic suppliers may have a greater ability to meet demands.
Supplier Information
Altom Transport Inc.
Altom Transport Inc. is a private company operating nationally. The company's offerings include petroleum & chemical trucking services. Founded in 1948, the company is currently headquartered in Hammond, Indiana, United States of America with an estimated 375 employees. Subscribe to learn more
Arcbest Corporation
Arcbest Corporation is a public company operating nationally in the other services (except public administration) sector. The company's offerings include refrigerated trucking services, local freight trucking services, national trucking services, petroleum & chemical trucking services, truck maintenance &... Subscribe to learn more
Blueknight Energy Partners, L.P.
Blueknight Energy Partners, L.P. is a public company operating nationally. The company's offerings include petroleum & chemical trucking services. Founded in 2007, the company is currently headquartered in TULSA, Oklahoma, United States of America with an estimated 130 employees. Subscribe to learn more
Heniff Transportation Systems LLC
Heniff Transportation Systems LLC is a private company operating internationally. The company's offerings include petroleum & chemical trucking services. Founded in 1998, the company is currently headquartered in Oak Brook, Illinois, United States of America with an estimated 5500 employees. Subscribe to learn more
Kenan Advantage Group Inc.
Kenan Advantage Group Inc. is a private company operating internationally. The company's offerings include petroleum & chemical trucking services and bulk earth transportation services. Founded in 1991, the company is currently headquartered in North Canton, Ohio, United States of America with an estimated... Subscribe to learn more
Knight-Swift Transportation Holdings Inc.
Knight-Swift Transportation Holdings Inc. is a truckload carrier and transportation solutions provider. It offers multiple truckload transportation, intermodal, and logistics services. It operates a nationwide network of business units and terminals in the US and Mexico. It also contracts with third-party... Subscribe to learn more
Quality Carriers Inc.
Quality Carriers Inc. is a private company operating internationally. The company's offerings include petroleum & chemical trucking services. Founded in 1985, the company is currently headquartered in Tampa, Florida, United States of America with an estimated 5500 employees. Subscribe to learn more
Ruan Transportation Management Systems
Ruan Transportation Management Systems is a private company operating internationally. The company's offerings include petroleum & chemical trucking services, bulk food-grade transportation services and bulk earth transportation services. Founded in 1932, the company is currently headquartered in Des Moines,... Subscribe to learn more
Schneider National, Inc.
Schneider National, Inc. is a public company operating nationally in the professional, scientific and technical services sector. The company's offerings include rail cargo transportation services, local freight trucking services, national trucking services, petroleum & chemical trucking services, drayage Subscribe to learn more
Accelerate the vendor selection process
Get a clear picture of the competition in a market and discover which vendors are best-suited for your sourcing needs. Our supplier profiles include hard-to-find financial ranges for private companies, cover public company data and feature an interactive competitor matrix.
Procurement Management KPIs for the Petroleum & Chemical Trucking Services Market
Managing vendor performance throughout the contract period is easier when tracking specific key performance indicators (KPIs). For example, buyers should monitor Customer Retention Rate and Employee Training Rate. Buyers may experience better performance throughout their contracts if they establish service level agreements (SLAs) based on Pricing and other factors.
| KPI | Level of Importance (1-5) | Measurements | Key Considerations |
|---|---|---|---|
| Customer Retention Rate |
|
Number of Customers at Start of Period Number of Customers at End of Period Number of Customers Added within Period |
The customer retention rate represents the number of customers a company is able to retain over a set time frame. Buyers with recurring needs should place higher importance on the customer retention rate. A high customer retention rate in a market with low specialization and switching costs indicates customers are satisfied with the price and level of service provided. |
| Employee Training Rate |
|
Number of Employees that Undergo Evaluation Number of Employees that Pass Evaluation |
The employee training rate represents the share of employees a company is able to successfully train. A low employee training rate should be compared with the number of damaged shipments to determine if employees are handling products and goods properly. |

Questions to Ask During Procurement Negotiations
How can I gain leverage during negotiations?
Security
Can I audit your procedures or appoint a third party to do so?
What third-party audits have you undergone recently?
Reputation
How long have you provided trucking services to customers in my industry?
Who are your top five clients and how long have they been your clients?
Logistics
How often do you revise fuel surcharges?
What causes fuel surcharges to escalate?
The ultimate prep for procurement negotations
View all 25 negotiation questions for this category when you subscribe.
Petroleum & Chemical Trucking Services RFP Guidelines
What should my RFP include?
Organizational Overview
Buyers should describe their organization explain why they are seeking sales and marketing software.
Buyers should specify the locations to which they require petroleum and chemical deliveries.
Statement Of Need
Buyers should state what types of petroleum and chemical deliveries they require, and their delivery schedules.
Buyers should specify the capacity that they will require, including their preferred size of trucks or containers that they prefer their products or liquids be transported in.
Project Budget
Buyers should specify the type and duration of the contract they wish to enter.
Buyers should request a detailed breakdown of the vendor’s price per loaded mile, type of liquid shipped, number of miles and mandatory fees applied to each shipment.
The RFP process made easy
Find out how you can access RFP templates for 800+ procurement categories to start writing better, more consistent RFPs.
We display average pricing information, trends and market data.
Our Reports include:
- Opportunity assessment
- Market dynamics
- Recent developments
- Positive and warning trends
- Buyer power levers
- Price environment and market pricing
- Geographic wage rates
- Global market updates
- Total cost of ownership
- Cost structure benchmarks and analysis
- Supply chain and vendors
- Global supplier breakdown
- Market share concentration
- Regulation and business requirements
- Vendor management and KPIs
- Sourcing strategy guidance