Procurement Market Intelligence Report
Solar Panel Installation
Sourcing Guide & Market Intelligence
Smarter cost management starts with comprehensive market intelligence
 United States
 Europe
 Global
Quick Navigation
Solar Panel Installation Global Overview
Definition
Summary
Solar panel installation services include solar tracker panels and roof-mounted solar panel installation. Typically, solar panel manufacturers or solar marketing firms contract suppliers to install panels on residential and non-residential buildings. However, some manufacturers provide this service directly.
This Report Includes:
- Solar Tracker Panel Installation
- Solar Panel Installation
Not in this Report:
- Homeowner-Requested Installation
- Solar Panel Wholesaling
Take the ProcurementIQ products and data tour
Explore live samples of price trend forecasts, price driver projections, forward-looking cost structure data and more.
Global Solar Panel Installation Procurement Trends
Discover the top international trends affecting procurement in the global Solar Panel Installation market.
Warning Trends
Tariffs to negatively impact the building and construction machinery sector
- The Trump Administration’s reciprocal tariffs, which apply general tariff rate increases to most countries the United States trades with, are set to take effect on August 7, after the administration finalized the national rates on August 1. As a result, leading sources of imported construction machinery face significantly higher tariff rates, including Japan (15.0%), Mexico (25.0%), South Korea (15.0%), the European Union (15.0%), the United Kingdom (10.0%), China (54.0%), and Canada (35.0%).
- The increase in tariffs on building and construction machinery imported from tariff-impacted countries will add to the price of imports, which are typically passed on to buyers in the form of higher prices. According to The Budget Lab at Yale, the additional tariffs on imports will increase overall prices for machinery and equipment by 13.3%.
- Additionally, the administration has already implemented 50.0% tariffs on all aluminum and steel imported into the United States, with the sole exception of imports from the United Kingdom. These tariffs will increase input costs even for construction machinery suppliers with domestic manufacturing operations.
- According to an April 2025 survey from Construction Equipment Magazine, around half of the respondents reported that the higher tariffs will increase operating costs by up to 15.0%, and more than half said they plan to pass those increases along to buyers.
- As many building and construction machinery brands source parts and components such as steel, engines, and electronics from foreign countries, higher tariff rates will put upward pressure on prices and lead to greater rental rates as manufacturers and dealers pass on costs. In addition, suppliers that source parts from tariff-affected regions may see supply chain disruptions as they seek alternative suppliers to mitigate tariff impacts.
Increased tariffs on copper imports take effect
- On August 1, the Trump administration implemented 50.0% tariffs on imported copper. Chile and Canada will be most impacted by these tariffs, as they account for a combined 87.0% of all copper imports in the United States.
- However, these tariffs are less sweeping than initially expected, only applying to semi-finished copper products, while excluding high-purity refined copper and copper input materials, such as ore and concentrate. As leading importers, such as Chile and Canada, have both high copper mining and refining capacities, they will likely avoid most of these tariffs by either exporting the copper in its unrefined form or refining the copper before exporting it to the United States
- These copper tariff exemptions limit the impact on the electronics and electrical equipment sectors because these applications require refined copper due to its optimal conductive properties.
- Thus, the prices of metal alloys that include copper, consumer products made from copper, tools, plumbing, corrosion-resistant alloys, and construction materials made from copper are forecast to rise by an average of 39.2%, according to the Yale Budget Lab.
China bans exports of rare minerals to the United States
- On December 4, China announced a ban on all exports of gallium, germanium, graphite, and antimony to the United States, escalating existing trade restrictions on these materials.
- China is the leading global producer of each of these metals, producing 98.3%, 67.9%, 62.0%, and 48.2%, respectively, of the world’s gallium, germanium, graphite, and antimony supplies, respectively.
- The United States can still access these resources from other trade partners who make up most of the remaining global supply of the impacted commodities, such as Canada, Japan, and Brazil.
- However, the loss of supply from China, the leading producer of these materials, will increase prices and supply chain risk in a range of markets that rely on the affected metals, such as the semiconductor, batteries, and solar cell markets.
- China’s export ban on these materials is in retaliation to expanded US export bans on advanced semiconductor manufacturing equipment and technologies to China announced two days prior. This ongoing trade dispute adds further uncertainty to technology markets, which are often reliant on components and materials exported from China.
Global Solar Panel Installation Market - Suppliers by Region
| Country/Region | Number of Suppliers |
|---|---|
| #1 Europe | 10,745 |
| #2 India | 9,170 |
| #3 China | 7,710 |
Explore supplier concentration across the globe
We've uncovered the 11 top regions for global procurement, based on feedback from our most strategic clients. Access vendor counts for each unique region when you subscribe.
Geography Drilldown - US & Europe
Average Cost of Solar Panel Installation
United States
2026 Market Pricing$30,000.00 to $XXX,XXX.XX
per panel
Average Price
Prices in the Solar Panel Installation market range from $30,000.00 to $XXX,XXX.XX, depending on System Size, Location and Panel Type. For example, lower prices are associated with 250 watts and 1.6x1 meters in size, whereas higher prices are associated with 400 watts and 2x1 meters in size.
Need the scoop on international price trends?
Between our Europe and Canada collections, we provide price data for 350 markets so you can instantly compare prices across borders. Or, use our custom research services for intel on prices in any region across the globe.
Solar Panel Installation Category Price Trends
Pricing trends are indicated by the compound annual growth rate (CAGR) during a set period of time. For the Solar Panel Installation market, prices in the US have grown 2.0% from 2022 to 2025. Meanwhile, the recent three-year CAGR for Europe is +0.7%.
United States (2022-2025)

Europe (2022-2025)
Compound Annual Growth Rate
Wondering where prices are heading?
Price trend forecasts are available to subscribers, along with price driver projections and forward-looking cost structure data.
Cost Analysis - Total Cost of Ownership for Solar Panel Installation
Total cost of ownership is Low in the Solar Panel Installation market. The average cost of ownership differs depending on the contract but generally includes costs negotiated before the contract begins, costs billed during the contract period and unforeseen costs. For example, unforeseen costs in the form of Downtime may raise the total cost of ownership unexpectedly.
Negotiated Before
Pre-evaluation
Billed During
Maintenance
Consumables
Disposal
Unforeseen
Downtime
Duties & Taxes
Buyer Power in Procurement Negotiations
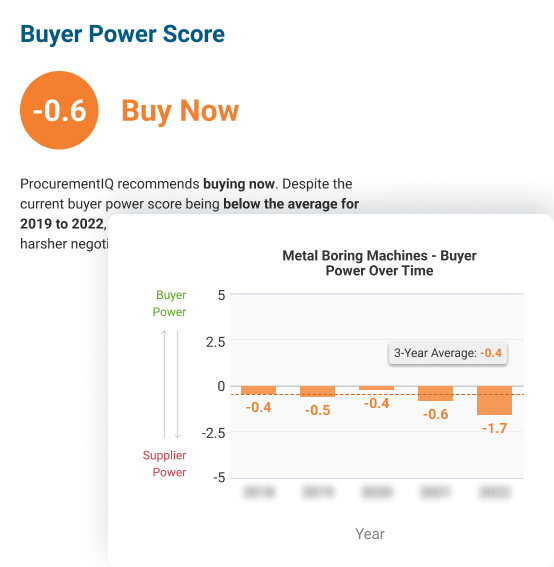
In 2026, buyer power amounts to -2.2 in the United States. Buyer power is most positively impacted by Recent Developments. It is most negatively impacted by Market Share Concentration. Subscribers can access details on eight other factors that impact buyer power. Learn more
United States

Buyer power forecasts: your glimpse into the future
Develop strategies for the upcoming year and identify unforeseen opportunities for buying now
- Actionable "Buy Now" and "Buy Later" insights
- Near-real-time updates to current and forecast Buyer Power Scores
- Methodology and weightings for Buyer Power Score Components
Supply Chain Risk
The average level of supply chain risk is assessed as High, which has a negative impact on buyer power. The level of supply chain risk is affected by industry volatility, barriers to entry, competition, import penetration, regulation and industry financial risk. Buyers in this market can mitigate procurement and supply chain management risks by monitoring risk levels for individual first and second tier suppliers:
1st
Tier Suppliers
- Solar Panel Manufacturers
- Construction & Mining Equipment Wholesalers
- Property, Casualty & Direct Insurance Providers
2nd
Tier Suppliers
- Plastic & Resin Manufacturers
- Semiconductor & Circuit Manufacturers
- Construction Machinery Manufacturers
- Third-Party Administrators & Insurance Claims Adjusters
Biggest Solar Panel Installation Suppliers in the US by Revenue
The largest Solar Panel Installation vendors by revenue in the US are Rosendin Electric Inc., SunPower Corporation and Helix Electric, Inc. Subscribers can sort and filter by market share concentration, profit level and other factors. Learn more
| Supplier | Operational Size | Headquarters | Number of Employees | Market Share (%) | Market Share Performance (3yr trend) | Total Revenue ($ million) | Profit Level (%) | Risk Level |
|---|---|---|---|---|---|---|---|---|
| First Solar, Inc. | Global | TEMPE, AZ | 1,001-10,000 | 5-10 | ||||
| Tesla, Inc. | PALO ALTO | >10,000 | < 5 | |||||
| Helix Electric, Inc. | US | < 5 | ||||||
| M. A. Mortenson Company | Global | Minneapolis, MN | 1,001-10,000 | < 5 | ||||
| Granite Construction Inc. | National | WATSONVILLE | 1,001-10,000 | < 5 | ||||
| MYR Group Inc. | National | THORNTON, IL | 1,001-10,000 | < 5 | ||||
| Rosendin Electric Inc. | National | San Jose, CA | 1,001-10,000 | < 5 | ||||
| SunPower Corporation | Global | RICHMOND, CA | 1,001-10,000 | < 5 | ||||
| E Light Electric Services Inc. | National | Englewood, CO | 251-1000 | < 5 | ||||
Looking for a list of suppliers by country?
Subscribers can access vendor information on Canadian and European suppliers, too. We also offer custom research services to help with vendor sourcing anywhere in the world.
Profit Analysis
The average profit margin across vendors in the Solar Panel Installation market is 6.3% and steady. Profit levels shift depending on suppliers' spend on wages, purchases and overhead. The highest cost component for vendors is Purchases. The cost trend for this component is rising, when considering movement between 2025 and 2026. To understand cost forecasts for 2027 and uncover the implications on profit, start your subscription. Learn more
Vendor & Supply Chain Analysis
Financial risk among solar panel installation vendors is low due to growth in industry revenue. However, financial risk may vary due to intense competition facilitated by low market share concentration and high import penetration.
The solar panel installation market has a low market share concentration because most vendors are small operators serving buyers within narrow geographic areas.
The supply chain for solar panel installation services has a high degree of risk, which is primarily a result of the tariffs placed on PV panels by the Trump administration in January 2018.
The solar panel installation market has a high level of regulation, and regulatory change has been fast.
As a net importer of solar cells, the US receives technologically advanced products at competitive prices from global leaders in solar technology. However, reliance on imports could lead to supply chain vulnerabilities, hampering domestic manufacturing growth and thus introducing risk in this market.
Supplier Information
First Solar, Inc.
First Solar, Inc. is a solar technology company that provides photovoltaic (PV) solar energy solutions. It manufactures and sells PV solar modules with advanced thin film semiconductor technology, providing a high-performance, lower-carbon alternative to conventional crystalline silicon PV solar modules. Subscribe to learn more
E Light Electric Services Inc.
E Light Electric Services Inc. is a private company operating nationally in the construction sector. The company's offerings include solar panel installation. Founded in 1998, the company is currently headquartered in Englewood, Colorado, United States of America with an estimated 625 employees. Subscribe to learn more
Granite Construction Inc.
Granite Construction Incorporated is a diversified construction and construction materials company. It organizes its business into two segments: the Construction segment, which constructs and rehabilitates public infrastructure, water-related construction, and various complex projects, including infrastructure... Subscribe to learn more
Helix Electric, Inc.
Helix Electric, Inc. is a private company operating nationally in the construction sector. The company's offerings include solar panel installation. Founded in 2017, the company is currently headquartered in San Diego, California, United States of America with an estimated 5500 employees. Subscribe to learn more
M. A. Mortenson Company
M. A. Mortenson Company is a private company operating globally in the construction sector. The company's offerings include solar panel installation and transmission tower construction. Founded in 1954, the company is currently headquartered in Minneapolis, Minnesota, United States of America with an estimated... Subscribe to learn more
MYR Group Inc.
MYR Group Inc. is a specialty electrical construction service provider to the electric utility infrastructure, commercial, and industrial construction markets. It provides electric transmission and distribution networks and substation facilities, including design, engineering, procurement, construction, upgrade,... Subscribe to learn more
Renewable Energy Systems Ltd
Renewable Energy Systems Ltd is a private company operating globally in the construction sector. The company's offerings include solar panel installation. Founded in 1981, the company is currently headquartered in Kings Langley, United States of America with an estimated 5500 employees. Subscribe to learn more
Rosendin Electric Inc.
Rosendin Electric Inc. is a private company operating nationally in the construction and manufacturing sectors. The company's offerings include building lighting control systems, solar panel installation and electrical contracting services. Founded in 1919, the company is currently headquartered in San Jose,... Subscribe to learn more
SOLV Energy LLC
SOLV Energy LLC is a private company operating nationally in the construction sector. The company's offerings include solar panel installation and renewable energy construction services. Founded in 2021, the company is currently headquartered in San Diego, California, United States of America with an estimated... Subscribe to learn more
Accelerate the vendor selection process
Get a clear picture of the competition in a market and discover which vendors are best-suited for your sourcing needs. Our supplier profiles include hard-to-find financial ranges for private companies, cover public company data and feature an interactive competitor matrix.
Procurement Management KPIs for the Solar Panel Installation Market
Managing vendor performance throughout the contract period is easier when tracking specific key performance indicators (KPIs). For example, buyers should monitor Average Order Value and Cost of Goods Sold. Buyers may experience better performance throughout their contracts if they establish service level agreements (SLAs) based on Compliance and other factors.
| KPI | Level of Importance (1-5) | Measurements | Key Considerations |
|---|---|---|---|
| Average Order Value |
|
Total revenue Number of orders |
The average order value represents the revenue generated from the average order. The average order value can be used to assess a company’s ability to provide large volumes of product. |
| Cost of Goods Sold |
|
Total revenue Total labor cost Total material cost Total service cost Total delivery cost |
The cost of goods sold represents the cost of providing products and services. The cost of goods sold can determine a supplier's profitability. The cost of goods sold can indicate a supplier's exposure to supply disruptions and upstream price shocks. |

Questions to Ask During Procurement Negotiations
How can I gain leverage during negotiations?
Regulation
By what methods do you stay informed about ongoing regulatory changes?
How have you adjusted to new regulations in the market? How have additional compliance costs been handled?
Supply Chain Risk
Do you source materials with a high exposure to market disruptions resulting from tariffs?
How diversified is your supplier base for inputs? Do you source from multiple suppliers in different global regions?
Insurance
Are your employees insured or bonded? What is your claim record?
Do you have any additional insurance policies? What is the amount of coverage on each?
The ultimate prep for procurement negotations
View all 31 negotiation questions for this category when you subscribe.
Solar Panel Installation RFP Guidelines
What should my RFP include?
Organizational Overview
Buyers should describe their operations (municipal, commercial, industrial, etc.) to give prospective suppliers an idea of their power needs.
Buyers should provide a detailed description of their operational structure, including to whom contractors will report.
Statement Of Need
Buyers should provide specific information regarding on-site characteristics, including aerial photographs, topographic maps, and current building plans.
Buyers should list all equipment and materials furnished to suppliers and those responsible for providing them.
Project Budget
Buyers should explicitly state the award amount.
Buyers should describe the expected pricing model (e.g., value-based).
The RFP process made easy
Find out how you can access RFP templates for 800+ procurement categories to start writing better, more consistent RFPs.
We display average pricing information, trends and market data.
Our Reports include:
- Opportunity assessment
- Market dynamics
- Recent developments
- Positive and warning trends
- Buyer power levers
- Price environment and market pricing
- Geographic wage rates
- Global market updates
- Total cost of ownership
- Cost structure benchmarks and analysis
- Supply chain and vendors
- Global supplier breakdown
- Market share concentration
- Regulation and business requirements
- Vendor management and KPIs
- Sourcing strategy guidance