Procurement Market Intelligence Report
Shopping Carts
Sourcing Guide & Market Intelligence
Smarter cost management starts with comprehensive market intelligence
 United States
 Global
Quick Navigation
Shopping Carts Global Overview
Definition
Summary
Shopping carts help shoppers transport their items through a store and to the cash register. Buyers of shopping carts range from grocery stores, warehouse clubs and supercenters to consumer electronics stores and home improvement stores.
This Report Includes:
- Standard Metal-Wire Shopping Carts
- Standard Plastic Shopping Carts
- Heavy-Duty Shopping Carts
- Express Shopping Carts
- New Shopping Carts
Not in this Report:
- Handheld Shopping Baskets
- Motorized Shopping Carts
- Refurbished Shopping Carts
Take the ProcurementIQ products and data tour
Explore live samples of price trend forecasts, price driver projections, forward-looking cost structure data and more.
Global Shopping Carts Procurement Trends
Discover the top international trends affecting procurement in the global Shopping Carts market.
Warning Trends
Reciprocal tariffs drive up packaging product prices
- The Trump administration’s reciprocal tariffs, which apply general tariff rate increases to all products imported from most nations, are set to take effect on August 7 after the national tariff rates were finalized on August 1. Additionally, 50.0% tariffs on all steel and aluminum imports, except those from the United Kingdom, went into effect in June.
- These tariffs will have a significant effect across the packaging industry as the United States imports a combined total of more than $127 billion worth of plastic, steel, and lumber annually, the three most common materials in packaging products.
- Leading packaging product importers include Canada, Mexico, and China, which face tariff rates of 35.0%, 25.0%, and 20.0%, respectively, with the Chinese import tariff rate set to rise to 54.0% in August. However, United States-Mexico-Canada Trade Agreement (USMCA)-originating goods, meaning those produced entirely in Canada or Mexico, are exempt from these tariffs.
- China accounts for 48.6% of imported plastic products in the United States, making current and upcoming tariffs on Chinese goods particularly impactful for the price of plastic packaging materials, which the Yale Budget Lab projects will rise in price by 11.0%.
- Likewise, Canada and Mexico provide a combined 51.6% of lumber imports, driving a 6.8% increase in the price of wooden products. Steel and aluminum tariffs are projected to fuel a 39.2% increase in the cost of metal packaging products on average.
United States announces new tariffs on all imported steel
- In February 2025, the United States announced 25.0% tariffs on all imported steel with no exemptions or exceptions. The tariffs took effect on March 12, 2025. On June 4th, these tariffs were increased further to 50%. These tariffs were not impacted by a recent court decision that temporarily suspended duties on certain goods as they were implemented under Section 232 of the Trade Expansion Act.
- Previously, countries such as Canada, Mexico, and Brazil, the top exporters of steel to the United States, had exemptions from tariffs. These have now been removed and all imported steel, regardless of origin, will be subject to the 50.0% tariff. However, on May 8th, the US announced an agreement with the United Kingdom to remove all levies on steel exported from the UK.
- When tariffs on steel imports were introduced in March 2018, they contributed to an increase in the price of steel and steel products. According to the Bureau of Labor Statistics, the price of steel-milled products increased by 10.2% in the year after the tariffs were implemented. This market heavily relies on steel as an input and may be impacted by this policy.
Global Shopping Carts Market - Suppliers by Region
| Country/Region | Number of Suppliers |
|---|---|
| #1 Europe | 885 |
| #2 China | 695 |
| #3 India | 505 |
Explore supplier concentration across the globe
We've uncovered the 11 top regions for global procurement, based on feedback from our most strategic clients. Access vendor counts for each unique region when you subscribe.
Geography Drilldown - US
Average Cost of Shopping Carts
United States
2026 Market Pricing$70.00 to $XXX.XX
per cartAverage Price
Prices in the Shopping Carts market range from $70.00 to $XXX.XX, depending on Material, Size, Type, Additional Features and Volume. For example, lower prices are associated with Metal ($120 to $260 per cart), whereas higher prices are associated with Plastic ($140 to $290 per cart).
Need the scoop on international price trends?
Between our Europe and Canada collections, we provide price data for 350 markets so you can instantly compare prices across borders. Or, use our custom research services for intel on prices in any region across the globe.
Shopping Carts Category Price Trends
Pricing trends are indicated by the compound annual growth rate (CAGR) during a set period of time. For the Shopping Carts market, prices in the US have grown 0.7% from 2022 to 2025. Subscribers can access price trend forecasts, price driver projections and forward-looking cost structure data. Learn more
United States (2022-2025)


Wondering where prices are heading?
Price trend forecasts are available to subscribers, along with price driver projections and forward-looking cost structure data.
Cost Analysis - Total Cost of Ownership for Shopping Carts
Total cost of ownership is Low in the Shopping Carts market. The average cost of ownership differs depending on the contract but generally includes costs negotiated before the contract begins, costs billed during the contract period and unforeseen costs.
Billed During
Spare Parts
Maintenance
Buyer Power in Procurement Negotiations
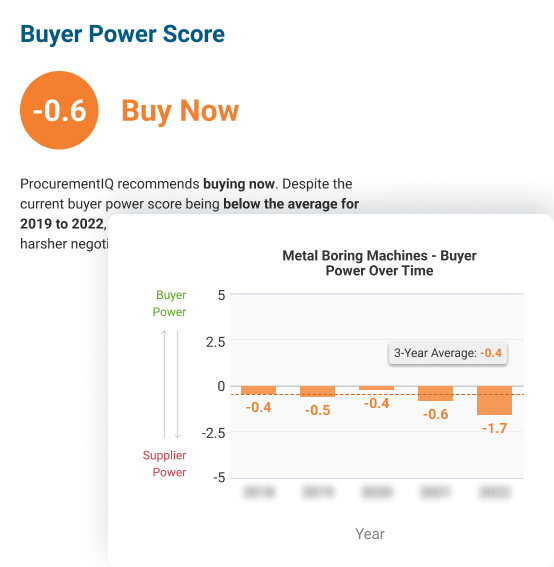
In 2026, buyer power amounts to -2.1 in the United States. Buyer power is most positively impacted by Recent Developments. It is most negatively impacted by Product Specialization. Subscribers can access details on eight other factors that impact buyer power. Learn more
United States
Buyer power forecasts: your glimpse into the future
Develop strategies for the upcoming year and identify unforeseen opportunities for buying now
- Actionable "Buy Now" and "Buy Later" insights
- Near-real-time updates to current and forecast Buyer Power Scores
- Methodology and weightings for Buyer Power Score Components
Supply Chain Risk
The average level of supply chain risk is assessed as Medium, which has a negative impact on buyer power. The level of supply chain risk is affected by industry volatility, barriers to entry, competition, import penetration, regulation and industry financial risk. Buyers in this market can mitigate procurement and supply chain management risks by monitoring risk levels for individual first and second tier suppliers:
1st
Tier Suppliers
- Steel Rolling & Drawing Suppliers
- Plastic Parts Manufacturers
- Caster & Cart Wheel Manufacturers
- Screw, Nut & Bolt Manufacturers
2nd
Tier Suppliers
- Iron & Steel Manufacturers
- Gasoline & Petroleum Wholesalers
- Rubber Product Manufacturers
- Nonferrous Metal Rolling & Alloying Suppliers
Biggest Shopping Carts Suppliers in the US by Revenue
The largest Shopping Carts vendors by revenue in the US are R.W. Rogers Company, Uline, Inc. and Wanzl GmbH & Co. KGaA. Subscribers can sort and filter by market share concentration, profit level and other factors. Learn more
| Supplier | Operational Size | Headquarters | Number of Employees | Market Share (%) | Market Share Performance (3yr trend) | Total Revenue ($ million) | Profit Level (%) | Risk Level |
|---|---|---|---|---|---|---|---|---|
| Wanzl GmbH & Co. KGaA | Global | Leipheim, DE | 1,001-10,000 | 25+ | ||||
| Unarco Industries LLC | International | Wagoner, OK | 251-500 | 25+ | ||||
| Uline, Inc. | International | Pleasant Prairie, WI | 1,001-10,000 | < 5 | ||||
| Advance Carts Inc. | International | Boca Raton, FL | 51-100 | < 5 | ||||
| National Cart Company | National | Saint Charles, MO | 51-100 | < 5 | ||||
| Versacart Systems Inc. | National | Boulder, CO | 51-100 | < 5 | ||||
| R.W. Rogers Company | National | St Charles, IL | <25 | < 5 | ||||
| Americana Companies Inc. | National | Omaha, NE | 51-100 | < 5 | ||||
| Premier Carts Inc. | National | Leawood, KS | 25-50 | < 5 | ||||
Looking for a list of suppliers by country?
Subscribers can access vendor information on Canadian and European suppliers, too. We also offer custom research services to help with vendor sourcing anywhere in the world.
Profit Analysis
The average profit margin across vendors in the Shopping Carts market is 6.2% and steady. Profit levels shift depending on suppliers' spend on wages, purchases and overhead. The highest cost component for vendors is Purchases. The cost trend for this component is falling, when considering movement between 2025 and 2026. To understand cost forecasts for 2027 and uncover the implications on profit, start your subscription. Learn more
Vendor & Supply Chain Analysis
There is a moderate level of vendor financial risk in this market. Although larger suppliers typically face a lower level of financial risk due to steady demand for their shopping carts, some local suppliers face more frequent fluctuations in demand due to the smaller buyer segments they serve.
Although moderate supply chain risk is unlikely to affect the supply of shopping cart components or raw materials, it may impact the price buyers ultimately pay for the product. Steel and plastic, the main materials used to construct shopping carts, are subject to considerable price volatility due to their commoditized nature.
There are about 250 companies that provide shopping carts to buyers throughout the United States. Unarco and Wanzl (dba Technibilt) generate an estimated 75.0% of market revenue combined, pointing to a very high level of market share concentration.
The United States is a net importer of shopping carts, meaning it imports more than it exports. Importing shopping carts from countries with lower manufacturing costs can lead to considerably lower prices for US buyers, although delivery lead times may be longer for imported products due to transportation and customs, and buyers face a greater risk of supply disruptions due to geopolitical tensions.
Supplier Information
Unarco Industries LLC
Unarco Industries LLC is a private company operating internationally in the manufacturing sector. The company's offerings include shopping carts. Founded in 1937, the company is currently headquartered in Wagoner, Oklahoma, United States of America with an estimated 375 employees. Subscribe to learn more
Wanzl GmbH & Co. KGaA
Wanzl GmbH & Co. KGaA is a private company operating globally in the manufacturing sector. The company's offerings include shopping carts. Founded in 1946, the company is currently headquartered in Leipheim, Bavaria, Germany with an estimated 4500 employees. Subscribe to learn more
Advance Carts Inc.
Advance Carts Inc. is a private company operating internationally in the manufacturing sector. The company's offerings include shopping carts. Founded in 2010, the company is currently headquartered in Boca Raton, Florida, United States of America with an estimated 61 employees. Subscribe to learn more
Americana Companies Inc.
Americana Companies Inc. is a private company operating nationally in the manufacturing sector. The company's offerings include shopping carts. Founded in 1975, the company is currently headquartered in Omaha, Nebraska, United States of America with an estimated 175 employees. Subscribe to learn more
National Cart Company
National Cart Company is a private company operating nationally in the manufacturing sector. The company's offerings include shopping carts. Founded in 1979, the company is currently headquartered in Saint Charles, Missouri, United States of America with an estimated 91 employees. Subscribe to learn more
Premier Carts Inc.
Premier Carts Inc. is a private company operating nationally in the manufacturing sector. The company's offerings include shopping carts. Founded in 1998, the company is currently headquartered in Leawood, Kansas, United States of America with an estimated 25 employees. Subscribe to learn more
R.W. Rogers Company
R.W. Rogers Company is a private company operating nationally in the manufacturing sector. The company's offerings include shopping carts and checkout counters. Founded in 1963, the company is currently headquartered in St Charles, Illinois, United States of America with an estimated 25 employees. Subscribe to learn more
The Peggs Company Inc.
The Peggs Company Inc. is a private company operating internationally in the manufacturing sector. The company's offerings include shopping carts. Founded in 1960, the company is currently headquartered in Riverside, California, United States of America with an estimated 135 employees. Subscribe to learn more
Uline, Inc.
Uline, Inc. is a private company operating internationally in the manufacturing, manufacturing and manufacturing sectors. The company's offerings include personal paper products, paper towels, receipt tape, paper cups, newsprint & offset papers. Founded in 1980, the company is currently headquartered in Pleasant... Subscribe to learn more
Accelerate the vendor selection process
Get a clear picture of the competition in a market and discover which vendors are best-suited for your sourcing needs. Our supplier profiles include hard-to-find financial ranges for private companies, cover public company data and feature an interactive competitor matrix.
Procurement Management KPIs for the Shopping Carts Market
Managing vendor performance throughout the contract period is easier when tracking specific key performance indicators (KPIs). For example, buyers should monitor Defect Density and Mean Time to Failure (MTTF). Buyers may experience better performance throughout their contracts if they establish service level agreements (SLAs) based on Delivery and other factors.
| KPI | Level of Importance (1-5) | Measurements | Key Considerations |
|---|---|---|---|
| Defect Density |
|
Number of shopping carts Number of defective shopping carts |
The defect density represents the share of defective products a company produces. The defect density can be used to determine whether manufacturing, assembly or quality assurance processes require improvement. Frequent defects can lead to shopping cart shortages at buyers' facilities and potential liability if the defects are not detected. |
| Mean Time to Failure (MTTF) |
|
Number of operational hours Number of shopping carts in use |
The mean time to failure represents the average time it takes for an operational shopping cart to become inoperative. The mean time to failure can be used to determine the average lifespan of a shopping cart. The mean time to failure is indicative of suppliers' product quality. Shopping carts with a short mean time to failure can increase operating costs for buyers because they will have to replace the carts more frequently. |
Questions to Ask During Procurement Negotiations
How can I gain leverage during negotiations?
Experience and Expertise
How long have you been active in this field? How long have you served operators in my industry?
What is your repeat business rate for businesses in my industry? How does that compare with your overall rates?
Competition
How do you win and retain business?
How do you stay competitive in the market, especially during the coronavirus pandemic?
Supply Chain Risk
How do you minimize production costs? How often do you pass on such costs to your clients?
Have you ever experienced a price spike from one or more of your suppliers? How did you cope with this spike?
The ultimate prep for procurement negotations
View all 31 negotiation questions for this category when you subscribe.
Shopping Carts RFP Guidelines
What should my RFP include?
Organizational Overview
Buyers should describe their organizations and explain why they are seeking shopping carts.
Buyers need to describe the type of good they are transporting, including dimensions and weight. This overview should give vendors enough information to quickly evaluate whether they can provide shopping carts that move the anticipated amount of cargo efficiently.
Statement Of Need
Buyers must provide the intended application of the shopping carts and the number of units desired.
Buyers should state the specifications of the shopping carts required.
Project Budget
Buyers should explicitly state the amount of the contract award.
Buyers should explain when and how many payments will be made.
The RFP process made easy
Find out how you can access RFP templates for 800+ procurement categories to start writing better, more consistent RFPs.
We display average pricing information, trends and market data.
Our Reports include:
- Opportunity assessment
- Market dynamics
- Recent developments
- Positive and warning trends
- Buyer power levers
- Price environment and market pricing
- Geographic wage rates
- Global market updates
- Total cost of ownership
- Cost structure benchmarks and analysis
- Supply chain and vendors
- Global supplier breakdown
- Market share concentration
- Regulation and business requirements
- Vendor management and KPIs
- Sourcing strategy guidance